Last year I wrote this simple chart plotting pool. While there are many chart plotting apps, I wanted to see what could be implemented entirely in Javascript using the Google Maps API (which means all you need is a web browser and it runs on any operating system). I've now added help in the form of hover tips so it's ready to share.
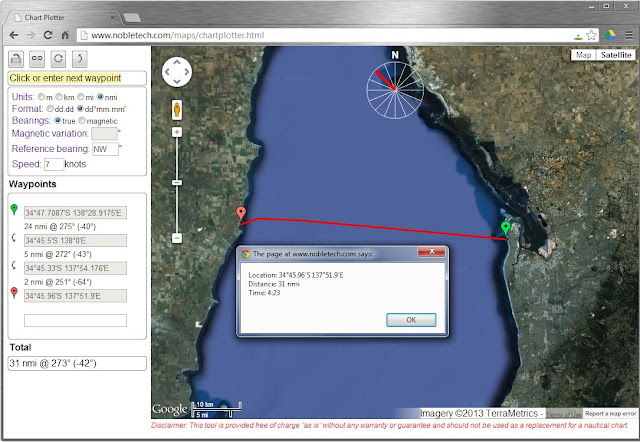
Below is a screenshot of the tool showing the route across Gulf St Vincent from North Haven to Port Vincent, South Australia - almost a straight shot except for avoiding the Orontes Bank.

- Top left are the buttons. The first button locks the chart to prevent further editing. The second button generates a link for sharing, with parameters encoded in the URL. For example, this is the link for the above chart. The next 2 buttons are for undo all and undo previous respectively.
- Immediately below the buttons is the message box, which instructs you what to do.
- Below that are the controls. Hover over any label to invoke help for that control.
- Next is the area for waypoints, and distances and bearings between waypoints.
- Bottom left is the total distance and bearing from start to finish.
- Right is an embedded Google Map. Simply pan and scroll to your area of interest.
Some useful features:
- Setting the bearing type to magnetic and entering a magnetic variation produces compass bearings instead of true bearings. For example, if the magnetic variation were set to +8° (i.e., magnetic north is 8° east of true north), the bearing for the first leg would be 267°M (rather than 275°).
- Setting the reference bearing to the wind direction computes bearings relative to the wind. A positive number means the wind is to port, and negative is to starboard. For example, above I've set the reference as NW, which means that the wind is 40° to the starboard for the first leg.
- Setting a speed computes travel times. For example, above I've set the speed to 7 knots. Clicking on any point on the route, or the end point, computes the time to reach that point. The dialog box above shows the total travel time is 4 hours 23 minutes.
Here is another route showing my last trip to Kangaroo Island.
Give it go and let me know what you think.
OVER.
Comments
Post a Comment